.png?width=250&name=SpoilerAlert_WhiteLogo_LeftStacked%20(7).png)

“You can’t manage what you can’t measure.” Is it a little bit cliche? Sure, but it’s still tried and true advice when it comes to just about every piece of your company. Managing excess and obsolete inventory follows exactly the same principle.
For Supply Chain, Sales, and Finance teams in the fast-moving CPG industry, it’s essential to invest the time to benchmark your excess and obsolete inventory. By benchmarking, you can effectively measure the impact of your optimization efforts and determine how much you’re moving the needle for the business. To that end, we’ve identified three KPIs (key performance indicators) that you should consider measuring, and written up some expert advice on how to benchmark them - accurately and effectively.
Before we dive in, let’s start with some simple definitions.
Defining terms
When we talk about excess and obsolete inventory, it’s crucial to have a clear understanding of what these terms encompass.
We previously outlined a definition for excess inventory with a pretty straightforward explanation. At its core, excess inventory refers to product that exceeds projected demand and is therefore expected to remain unsold. There are dozens of causes of excess, but here we’ll focus on inventory becoming obsolete.
We also described the differences between slow-moving, obsolete, and short-dated CPG inventory. Obsolete inventory is any stock that is out of season, has been discontinued, or has undergone packaging changes – in design, size, ingredients, or otherwise – that render it unsellable to primary retailers. Although the product itself may be in good condition and not yet approaching its guarantee date, it still qualifies as excess inventory because it won’t be sold in mainstream channels.
Obsolete inventory should be considered a form of excess inventory, but the least urgent category; unlike distressed or short-dated goods, it’s typically not approaching any kind of expiration date. Most of these KPIs apply to both obsolete and short-dated goods, but with different levels of urgency.
Key performance indicators
We published a separate post outlining some of the KPIs you can use to track your success. In this post, we’ll look more at setting baselines and improving upon them through continuous initiatives.
Sell through rate
What is it?
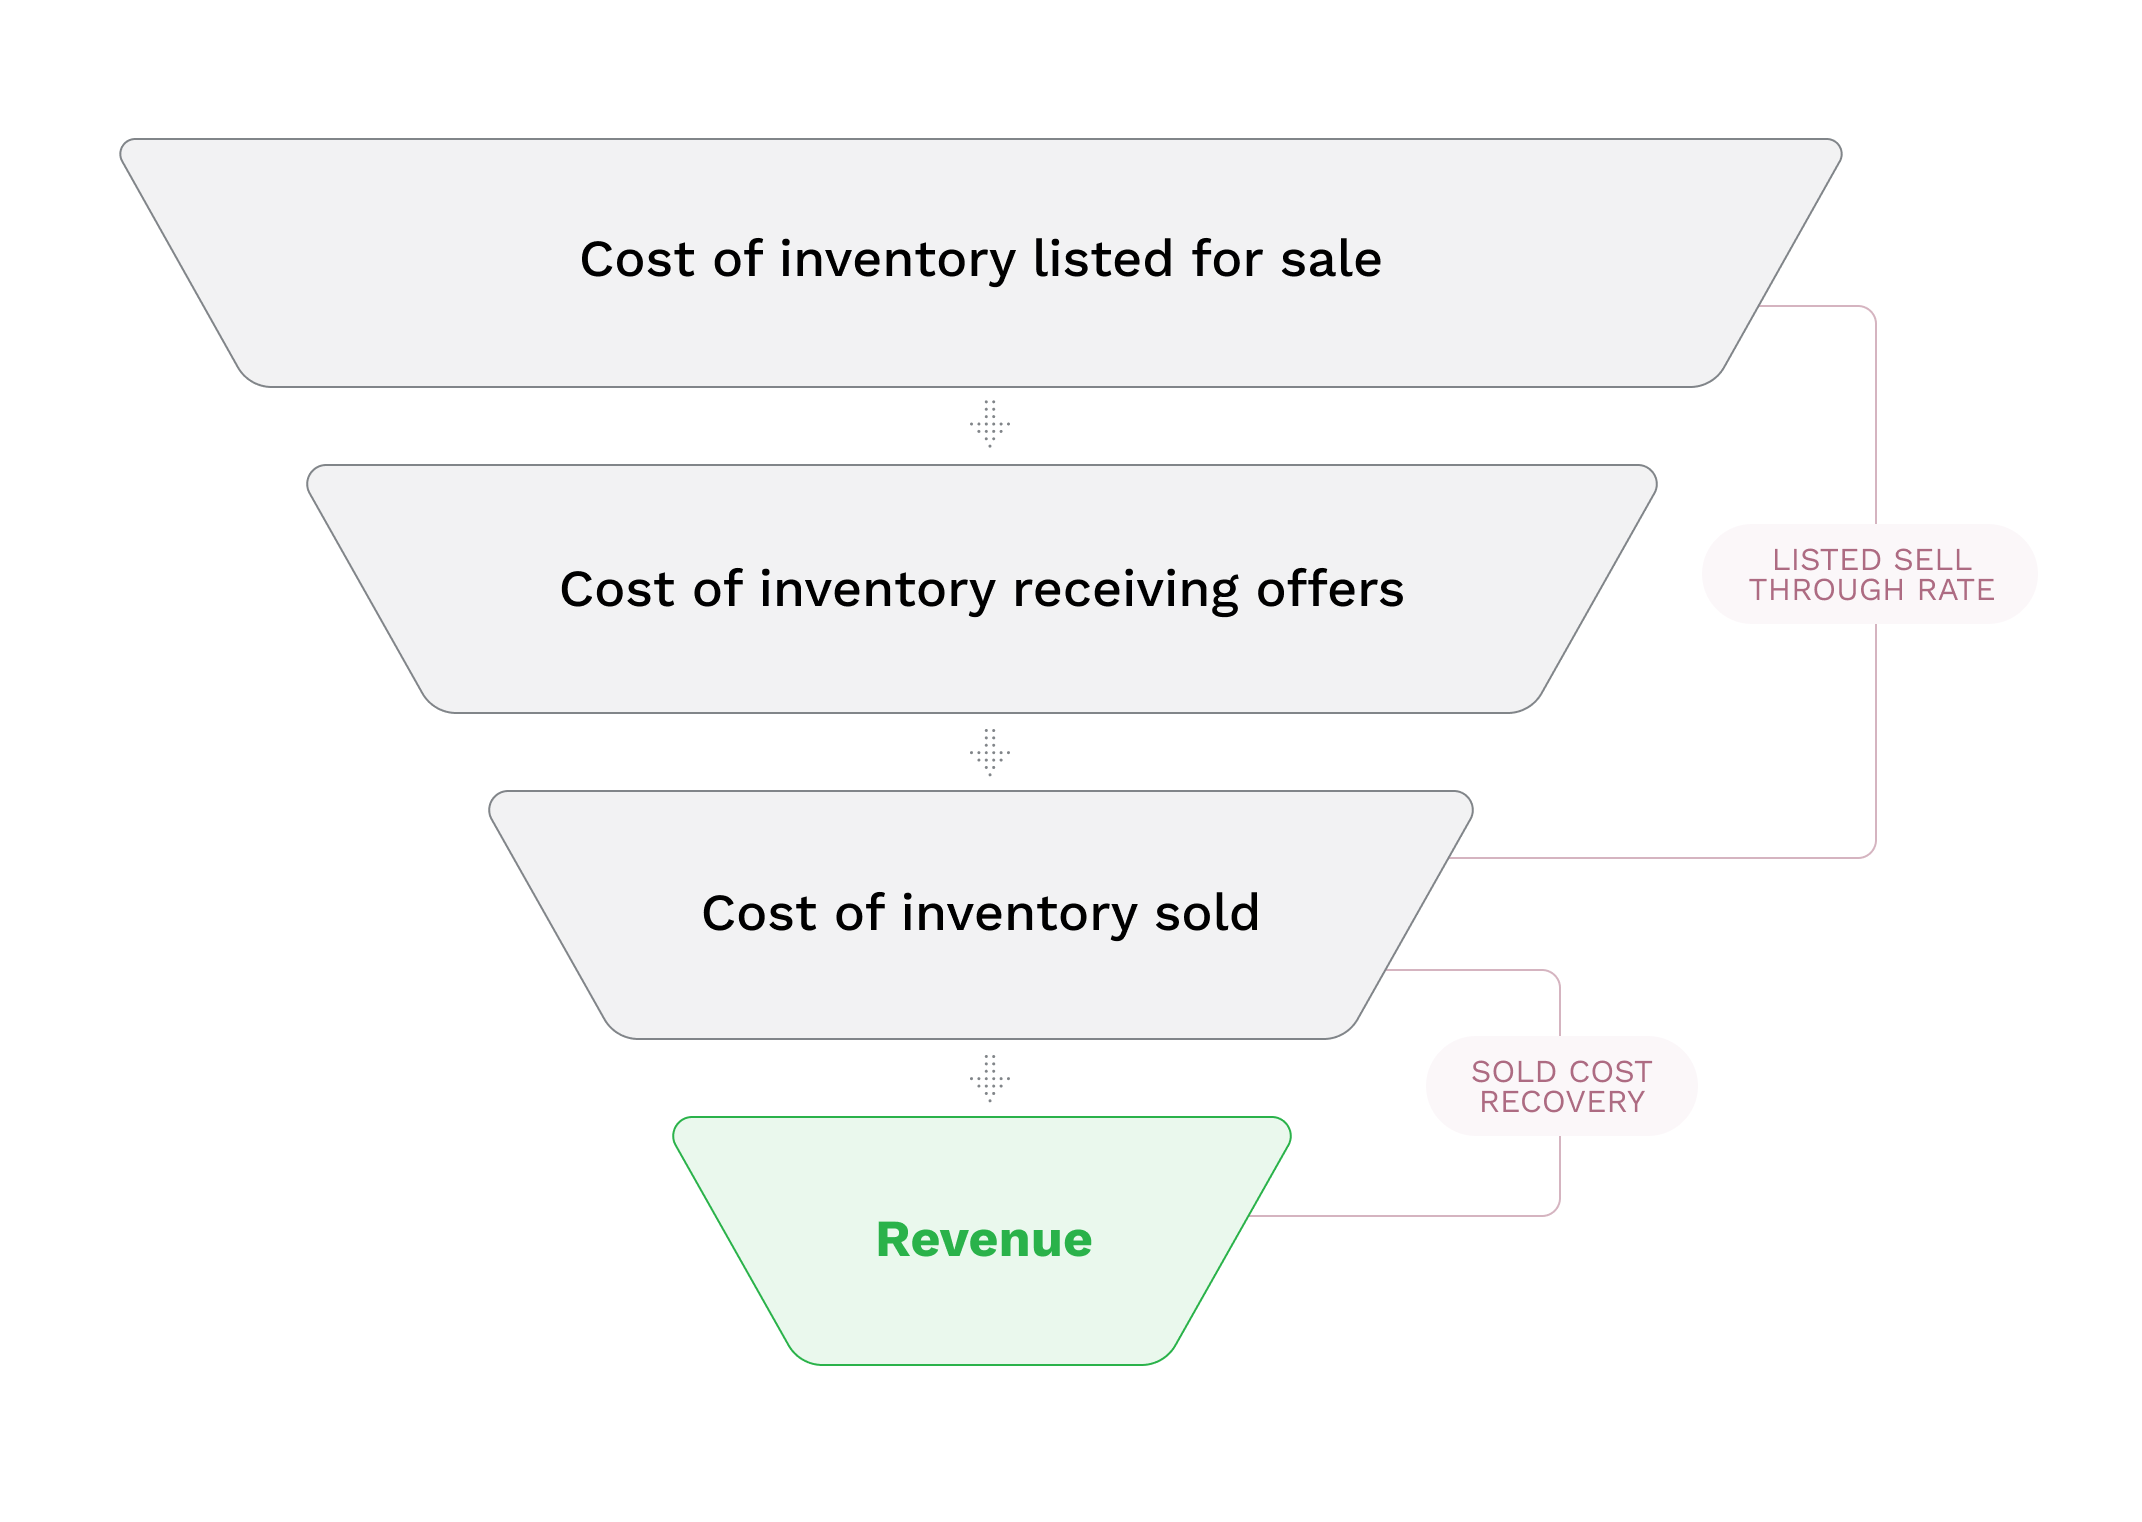
Sell through rate is a relatively easy concept to wrap your head around. Essentially, it’s the amount of excess inventory that’s actually sold, as a portion of what was available. You can measure this by case volume or by cost, though we typically recommend the latter.
Sell through rate = cost of sold inventory / cost of available inventory
Sell through rate is a useful metric for measuring the impact of your sales process and strength of your sales network. The more product you sell, the fewer cases get written off. That’s exactly what this KPI measures.
How do I benchmark it?
To benchmark your sell through rate, you’ll first want to look at historical data. Specifically, start with liquidation activities, as well as the P&L categories where unsold cases end up. (For most organizations, these include outcome codes for donation, dump or destruction.) Best practice suggests examining the trailing year of results, but as a general rule, the more data you examine, the more reliable (and seasonally adjusted) your numbers will be. Lay out your historical numbers and identify the total cost of available excess inventory. This should include all finished goods that your company didn’t sell through its normal, everyday channels and instead moved to liquidation, donation, or disposal channels. Now divide the cost of all of the inventory that did sell to this subset of customers by the total cost of available inventory.
Repeat this process for each liquidation cycle and patterns will start to emerge. It’s important to remember that some inventory will skip the discounting process entirely, and instead be sent straight to donation or dump. Because of this, your sell through rate may appear slightly lower than it is in reality. Inventory discounting software can help identify these gaps and give you a more accurate benchmark.
How do I improve it?
We see quite a range of sell through rates across the industry, but it’s often one of the biggest opportunities for improvement for any given company. One major manufacturer, for example, increased sell through rate by 33% after adopting Spoiler Alert.
Ensuring that all of your available inventory actually gets listed to potential buyers is the first step to improving sell through. Sales teams may try to simplify their process by excluding subsets of available inventory. They may also feel that buyers aren’t interested in it, so they skip the listing process. In reality, we routinely hear from buyers that they wish suppliers would share more (not less) and give them the option to decide what is and isn’t attractive.
Other sell through improvements come with simplifying your buyers’ purchasing experience, introducing workflows that streamline the process, and offering better terms, like delivery instead of pickup, with your orders.
You can go a step further by looking at what types of items have above or below average sell through rates. We recommend breaking it out by category or item size. For example, some retailers will want smaller pack sizes to keep price points low, or they might want hygiene products but not beauty care. This way you can direct your energy where it’s most needed and work on developing a buyer network that can support these unique segmentations.
Sold cost recovery rate
What is it?
Sold cost recovery rate falls right with sell through rate among the most important KPIs; it’s the cost you’ve recovered through your discounting program as a portion of the cost of sold inventory. That sounds a little bit complicated, so let’s look at an example: if one case of a given product costs $10 to produce and sells for $7 through a discounting program, then the sold cost recovery is 70%. Some teams prefer to measure the inverse of this, sometimes referred to as the discount rate. In the example above, a $7 outcome is a 30% discount off of cost.
Cost sold recovery rate = revenue / cost of inventory sold
Sell through rate gives more insight into what is and isn’t selling, but sold cost recovery narrows in on the goods that did sell and illustrates what value you’re getting from your liquidation events.
How do I benchmark it?
It’s actually pretty easy to benchmark sold cost recovery. Once again, we’re going to start with a look back. Pull data from your recent liquidation events and add up the revenue you earned. From there, calculate the cost of goods sold (COGS) for that same group of items. This lets you divide revenue by COGS to find your sold cost recovery rate. Manufacturers often strive to improve sold cost recovery rate by finding the best price point for their unique network of customers.
How do I improve it?
Increasing your sold cost recovery rate can be challenging, but it’s ultimately one of the biggest influences on the financial performance of your discounting program.
One approach to increasing sold cost recovery is usually by working through liquidation cycles more quickly to sell inventory with as much shelf life as possible. Discount retailers are consistently willing to offer more for items with longer shelf life because it increases the chance that they’ll fully sell through it. However, we find this to be more true for food items and less consistent for things like soaps and shampoos.
Instead, non-food CPG companies can have a greater impact by focusing on their buyer relationships. Building a diverse network of buyers can increase competition for certain items, minimize freight costs by finding locations closer to your distribution centers, and build deeper relationships that include non-price benefits for both parties.
Improving your offer sheets can also help speed up turnaround times and get products into the hands of your buyers sooner. And if shelf life isn’t a concern for your business, instead of focusing on speed to market, try to maintain a regular listing cadence in order to remain a preferred supplier.
Revenue
What is it?
Revenue, quite simply, is the amount of money that your discounting program brings in through all sales. In other words, it’s the sum total of your discounted sales activities, and in many ways is a combined result of your sell through and sold cost recovery rates.
This KPI is probably the single best summary metric to show the value of your discounting program, and is the most direct contributor in your bottom line.
How do I benchmark it?
If you have consistent, trustworthy bookkeeping, revenue should be very easy to find. Since revenue is usually readily available, you can also use it to back into one of the other KPIs outlined here.
If you don’t have direct access to revenue numbers, you can estimate the total discount revenue by multiplying your past available discount inventory by your sell through rate and then by your sold cost recovery rate.
How do I improve it?
Both sell through rate and sold cost recovery are levers that impact revenue, so by improving either (or both) of those metrics, you can also increase your revenue. It’s important to note that the total cost of your available inventory also factors in here. Your cost recovery and sell through rates can both increase, but if you have less available inventory to start with, your revenue could still decrease. This isn’t cause for alarm, as it could mean your organization is doing more to identify and sell inventory before it becomes obsolete. Data analytics tools can help manage your available inventory and communicate across business units so that you can see when a reduction in discount revenue is caused by inventory being sold into primary channels.
Benchmarking is for everyone
Almost all discounting programs can benefit from ongoing optimization, especially those that don’t have standardized documentation or procedures. Regardless of where you’re at today, it’s absolutely necessary to establish clear baselines so that you can measure the impacts of future innovation.
When you approach benchmarking, make sure to look at a wide range of data rather than relying on a single liquidation event to make sure you’re evaluating the average performance and not basing your benchmarks on one outlier.
For more on boosting revenue with effective buyer relationships, download our eBook.