.png?width=250&name=SpoilerAlert_WhiteLogo_LeftStacked%20(7).png)

“You can’t manage what you can’t measure.” It’s a bit of a platitude, but it remains tried and tested advice when it comes to just about every business imperative. Inventory management is no different.
For Sales, Supply Chain, and Finance leaders in the CPG industry, it’s vital that you take the time to benchmark your excess and obsolete inventory, so that as you invest in optimizing it, you can actually measure the progress you’re making and the impact you’re having on the business. With that in mind, we’ve collected three key metrics that you should be measuring, and provided some tips on how to benchmark them - accurately and effectively.
First, let’s start with some simple definitions.
Defining terms
It’s important to know exactly what we’re talking about when we say excess inventory and obsolete inventory.
We previously defined excess inventory with a very simple explanation. Basically, excess inventory is any inventory that exceeds projected demand, and is therefore not expected to sell. There can be many causes, and inventory becoming obsolete is one of them.
We’ve also outlined the differences between obsolete, slow-moving and short-dated inventory. Obsolete inventory is any stock that has been discontinued, is out of season, or has undergone packaging changes, and is therefore not being accepted by (or intentionally diverted away from) primary customers. The food or beverage itself might be perfectly good and far from its customer guarantee date, but it still qualifies as excess inventory.
You can generally consider obsolete inventory a form of excess inventory. However, it’s often one of the least urgent categories, because unlike short-dated or distressed goods, it’s typically not approaching its expiration date. Most of these KPIs will apply to both categories, but with slightly different senses of urgency.
Key performance indicators
We’ve previously outlined some of the most important KPIs you can use to measure success. Here, we’ll explore more of how you can set baselines and improve upon them through continuous optimization initiatives (some of which we’ve outlined here).
Sell through rate
What it is
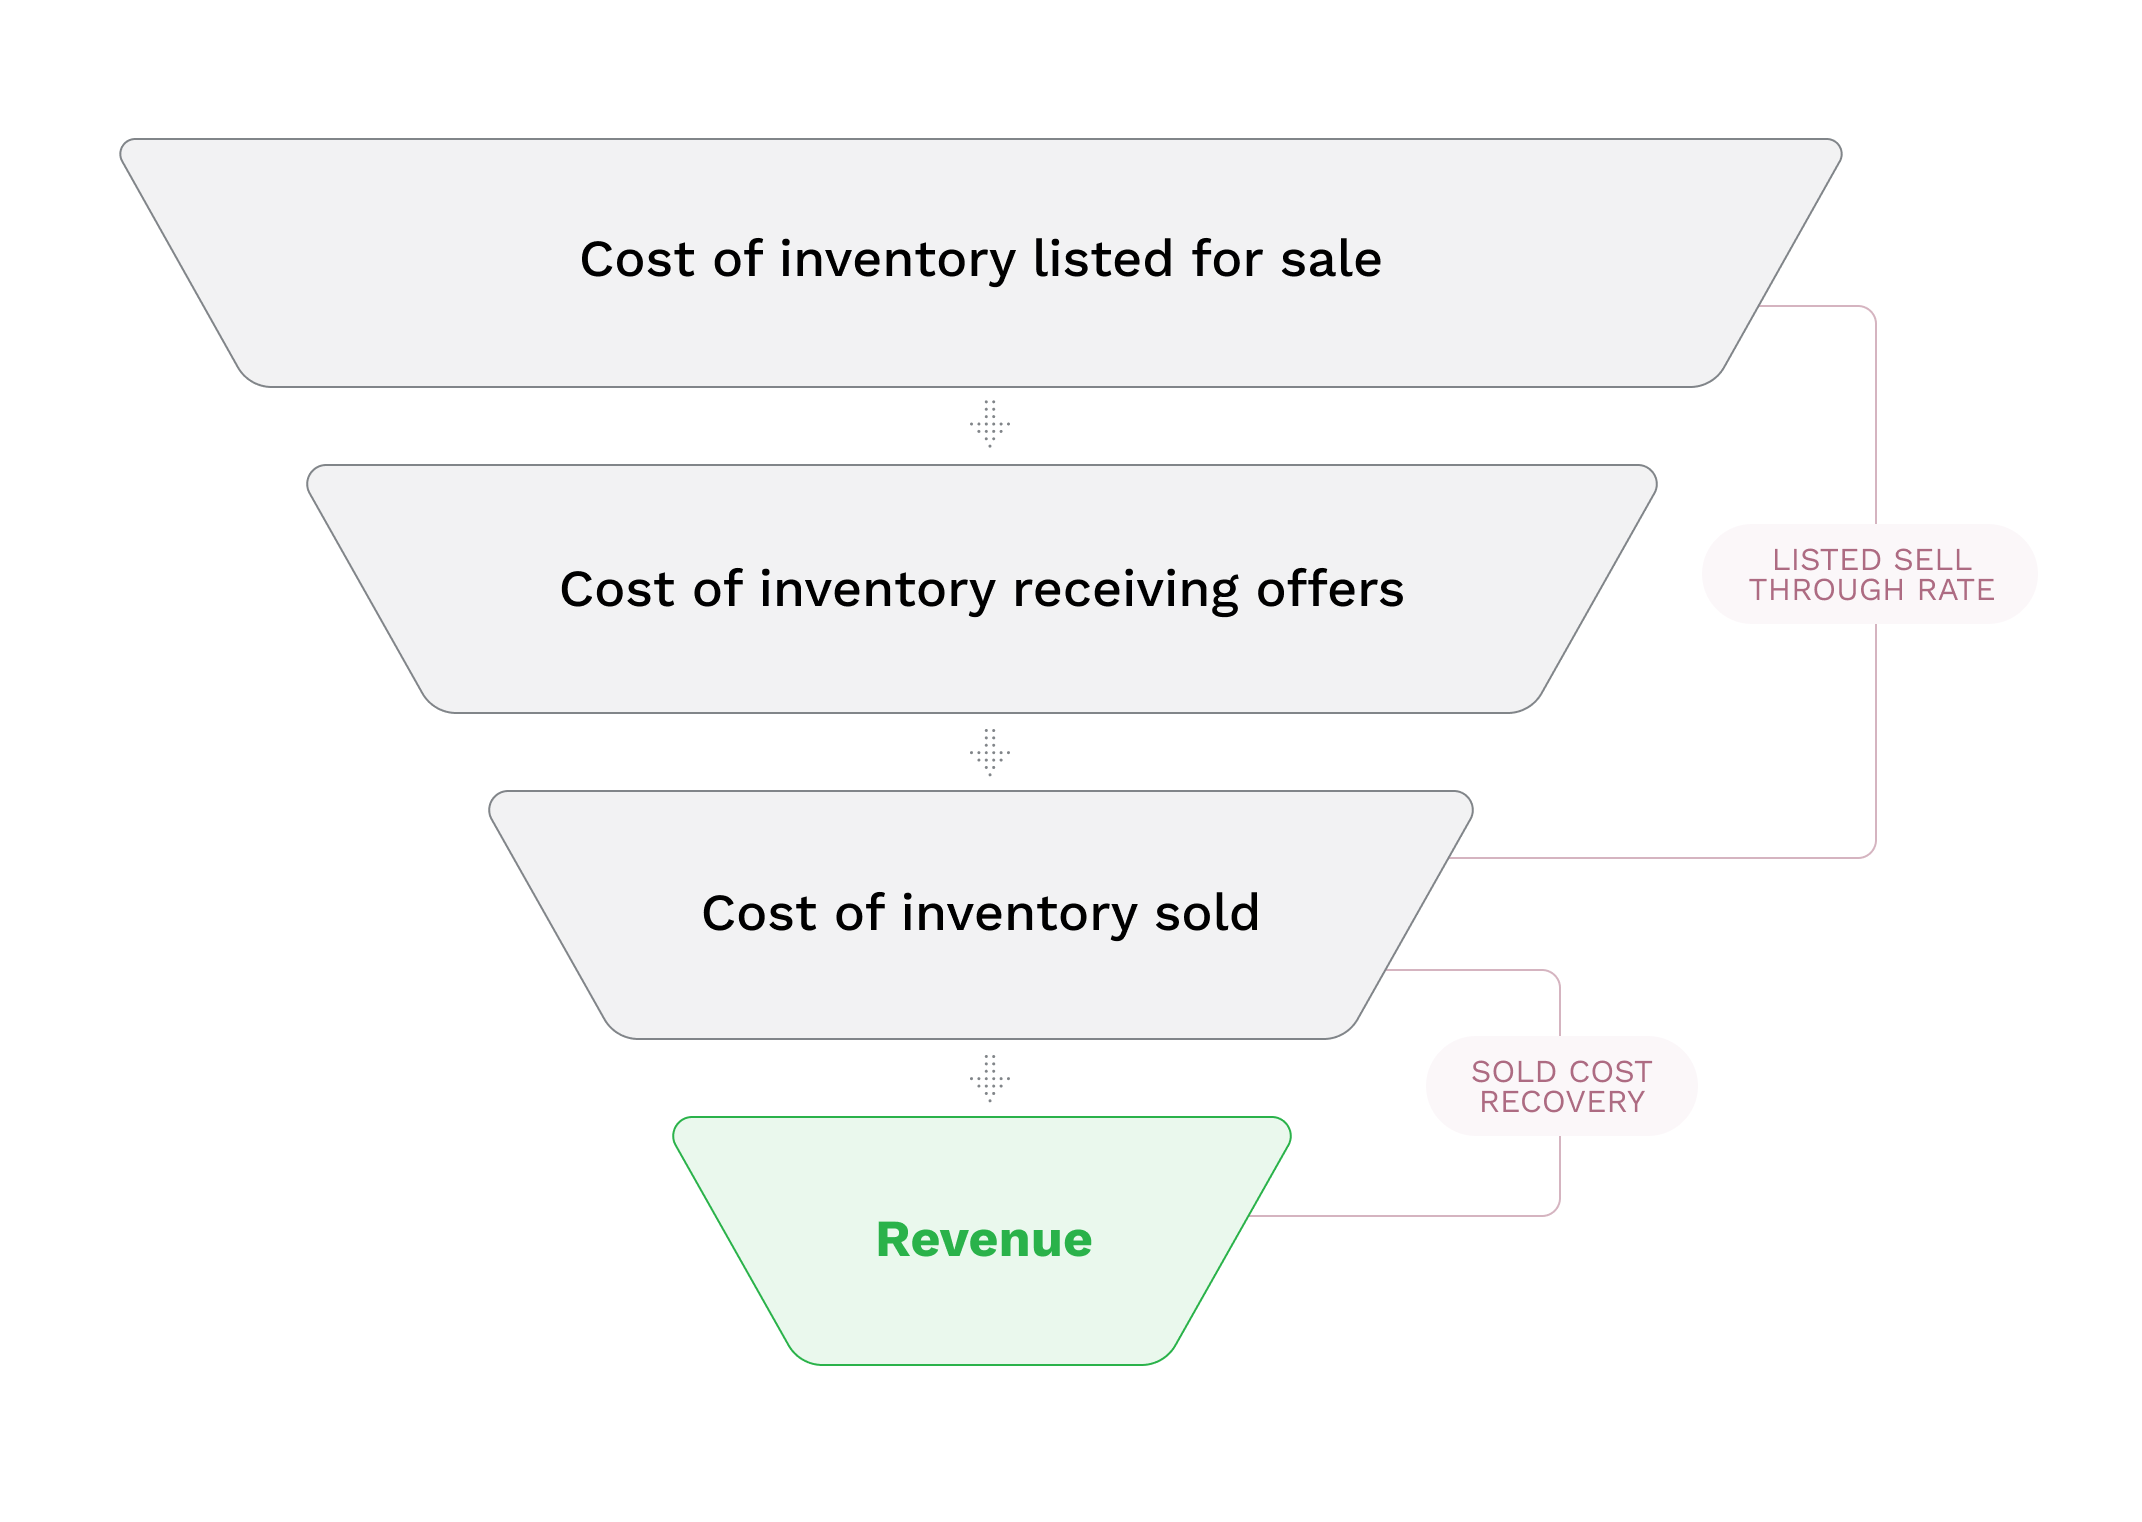
Sell through rate is a pretty simple concept. Essentially, it’s the amount of excess inventory that’s actually sold, as compared to the amount that was available. This can be measured by case volume or by cost, though we typically recommend the latter.
Sell through rate = cost of sold inventory / cost of available inventory
Sell through rate is a great metric to measure the effectiveness of your sales process and robustness of your sales network. Generally speaking, the more cases you sell, the fewer cases that get written off, and this KPI measures that.
How to benchmark
In order to benchmark your sell through rate, you’ll need to look at historical discount activities, as well as the P&L categories where unsold cases end up (usually donation, dump or destruction outcome codes). It’s generally best to look at the trailing 12 months of results, but the more you examine, the more reliable (and seasonally adjusted) your numbers will be. Dig into your historical numbers, and identify the total cost of available excess inventory. That includes all finished goods inventory that your company didn’t sell through its normal, everyday channels and instead moved to discount, donation, or disposal channels. Divide the cost of all of the inventory that did sell to this subset of customers by the total cost of available inventory.
Repeat that process after each closeout cycle and you’ll start to see a pattern. It’s important to note that some goods will be sent straight to donation or waste without ever going through the discount process. Because of this, your sell through rate may appear slightly lower than it is in reality. Discount sales software can help identify these gaps and give you a more accurate benchmark.
How to improve
We’ve seen a lot of variation in sell through rate in the industry, but it’s typically one of the biggest opportunities for improvement. One major manufacturer saw a 33% increase in sell through rate after starting to manage it through Spoiler Alert.
Sell through rate can often be improved, first by ensuring all of your available inventory actually gets shared with potential buyers. Sales teams will often be inclined to exclude subsets of the available inventory to simplify their process, or because they feel buyers might not be interested in it; in reality, one of the key themes of feedback we hear from buyers is that they wish their suppliers would share more (not less) and give them the flexibility to decide what is and isn’t attractive. Other improvements come with making the purchasing experience easier for your buyers, introducing intelligent workflows to streamline the process, and offering better terms with your orders.
It also helps to do a deeper dive into what types of items have high or low sell through rates. Amongst other segmentations, we recommend breaking it out by temperature zones – i.e. separate dry goods from refrigerated and frozen. You may find that shelf-stable products sell through very well, while items requiring cold storage have lower sell through rates, for example. This way you can focus your energy where it’s needed most and ensure you have a customer base that meets these unique segmentations.
Sold cost recovery rate
What it is
Sold cost recovery rate is right up there among the most important KPIs; it’s the amount of cost you’ve recouped through your discount program as a percentage of the cost of your sold inventory. For example, if a case of product costs $10 to produce and sells for $7 through a discounting program, one’s sold cost recovery is 70%. Some companies measure the inverse of this and refer to it as a discount rate - either measured off of the cost or wholesale price. In the example above, a $7 outcome is a 30% discount off its cost.
Cost sold recovery rate = revenue / cost of inventory sold
Where sell through rate gives more insight into what is and isn’t selling, sold cost recovery narrows in on the goods that did sell and shows what kind of value recovery you’re getting from your closeout events.
How to benchmark
Benchmarking sold cost recovery is relatively simple. Look back at your recent closeout events and see how much revenue you took in. From there, calculate the cost of goods sold for those same items. That will allow you to easily divide revenue by the cost of goods sold to arrive at your sold cost recovery rate. More often than not, a manufacturer’s goal is improve its sold cost recovery rate - finding the right price point that works for your network of customers and optimizes sell through rate as well.
How to improve
Improving your sold cost recovery rate can be challenging, but it ultimately is one of the key influencers of a discounting program’s financial performance.
Perhaps the most impactful way to increase sold cost recovery is by selling product with as much shelf life as possible, and as part of this, working through cycles more quickly. By increasing your speed to market and sales efficiency, you can get items communicated, negotiated and sold faster – farther from any potential expiration dates and therefore worth more to your customers. This is more urgent for short-dated or distressed inventory than for obsolete goods, but still important in both cases. Improving your offer sheets can help speed up turnaround times and get products into the hands of your buyers sooner. Other approaches include giving select buyers preferred access to inventory in exchange for more favorable pricing, or logistical “extras”, such as rushed delivery.
Revenue
What it is
Revenue is the amount of money that your discounting program brings in the door. It’s the sum total of your discounted sales activities and the culmination of your sell through and sold cost recovery rates.
This KPI is probably the single most important metric to prove the value of your discounting program – It’s the most direct factor in your bottom line.
How to benchmark
Revenue should be one of the easiest metrics to benchmark, as long as you’ve had reasonably reliable bookkeeping. Another way to arrive at revenue is by multiplying your historically available distressed inventory by your sell through rate and then by your sold cost recovery rate. This can also be a great way to back into one of the other KPIs since revenue figures are often the most readily available of the three.
How to improve
Because revenue is – at its core – a result of both sell through rate and sold cost recovery, you can improve it by improving either (or both) of those metrics. Of course, this is also dependent on the total cost of your available inventory. Your cost recovery and sell through rates can both go up, but if you have less inventory to start with, your total revenue could still drop. That’s not necessarily a bad thing – it could mean that your organization is doing more to identify and sell inventory before it becomes obsolete. A robust data analytics tool can help manage your available inventory and communicate that back to other business teams. That way you can clearly illustrate when a reduction in revenue is actually a good thing (because that inventory is being sold into primary channels instead).
Conclusion
Nearly all discounting programs can use ongoing optimization, especially those that are informal, poorly documented, or lack cadence and standard procedures. Regardless of where you’re at today, it’s essential to establish a clear baseline so that you can measure future progress.
Be sure to look at a range of results, not just one closeout event, to make sure you’re accurately seeing the average performance and not basing your benchmarks on an outlier.
For more on leveraging your offer process, download our new checklist, Offer Sheet Essentials.