.png?width=250&name=SpoilerAlert_WhiteLogo_LeftStacked%20(7).png)
For any company operating in the manufacturing space, collaboration between Supply Chain and Sales teams is critical for ensuring that production volumes remain in harmony with forecasted demand. Throughput, on-time availability, and blended case price are just a few of the traditional “metrics that matter” for optimizing normal retail channels sales.
When inventory is not sold through normal channels, food brands will often liquidate through closeout channels that specialize in short-dated, obsolete, discontinued, and seasonal items. In these cases, there tends not to be universally understood (or measured) KPIs for optimizing these liquidation outcomes. This might be because a brand doesn’t have full-time staff dedicated to these activities, or it might be because it falls into a grey-zone of accountability between Supply Chain and Sales.
For liquidation success, it’s helpful to think in terms of volume and value. Volume can be looked at in terms of moving as many cases as possible, whereas value can be looked at in terms of recovering the most dollars for this inventory. We define 3 KPIs below that we feel every liquidation team (or individual sales manager) should be measuring, and we visualize how all 3 fit together.
Sell Through Rate
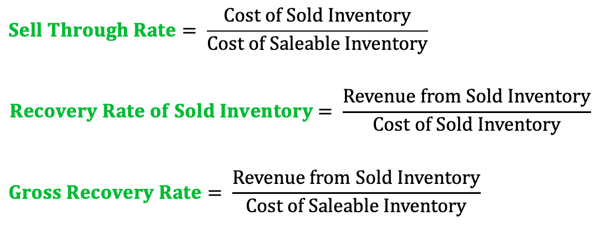
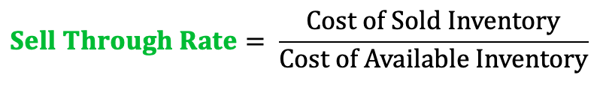
Sell Through Rate is our first recommended KPI. It is defined as the “cost of sold inventory” divided by the “cost of available inventory”.
Some guidance:
- For “cost”, we recommend using cost of goods sold (COGS), though cases or wholesale price can also be used.
- For “saleable inventory”, we recommend looking at finished goods inventory that a company hasn’t sold through its normal retail channels and for which a brand resorts to liquidation, donation, or disposal channels.
- And for “sold inventory”, we include anything sold into discount retail or through other liquidation channels, including brokers, or closeout distributors.
As an example, let’s take a food manufacturer who - last fiscal year - sold $8M (COGS) of inventory through liquidation channels, while donating $6M of product and dumping $6M of inventory. This company’s Sell Through Rate would be 40% (i.e. $8M divided by $20M of distressed inventory).
Recovery Rate of Sold Inventory
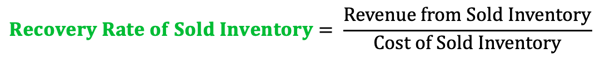
Whereas Sell Through Rate is the leading volume KPI, Recovery Rate of Sold Inventory is the leading value KPI. It is defined as the “revenue from sold inventory” divided by the “cost of sold inventory”.
Some guidance:
- For “revenue”, this should include gross receipts from the sale of distressed inventory only. Depending on whether a company offers delivered or FOB/customer pickup options to its closeout partners, it may or may not wish to incorporate freight costs into this equation.
- For “sold inventory”, use the same guidance above.
As an example, let’s take the same food manufacturer who - last fiscal year - sold $8M (COGS) of inventory through liquidation channels. These sales efforts generated $4M in revenue. This company’s Recovery Rate of Sold Inventory would be 50% (i.e. $4M of revenue divided by $8M of liquidated inventory).
Some companies prefer to use Discount Rate instead of Recovery Rate of Sold Inventory. Discount Rate represents the discount off of what this inventory cost to produce or normally sells for.

It is worth noting that some companies measure this against COGS, others measure it against wholesale prices. Choose what works best for your team, but be sure to keep the denominators (COGS vs. wholesale) consistent!
Gross Recovery Rate
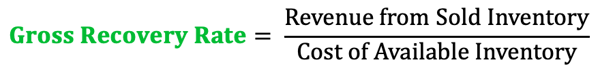
Where volume and value come together is Gross Recovery Rate, the ultimate “metric that matters” for measuring the success of a liquidation program. Gross Recovery Rate is defined as “revenue from sold inventory” divided by “cost of available inventory”.
Gross Recovery Rate can also be calculated by multiplying one’s Sell Through Rate by its Recovery Rate of Sold Inventory:

Sticking with the example above, this food manufacturer’s Gross Recovery Rate would be 20%, which is arrived at in one of two ways:
- $4M in revenue divided by $20M of distressed inventory, or
- 40% Sell Through Rate multiplied by 50% Recovery Rate of Sold Inventory
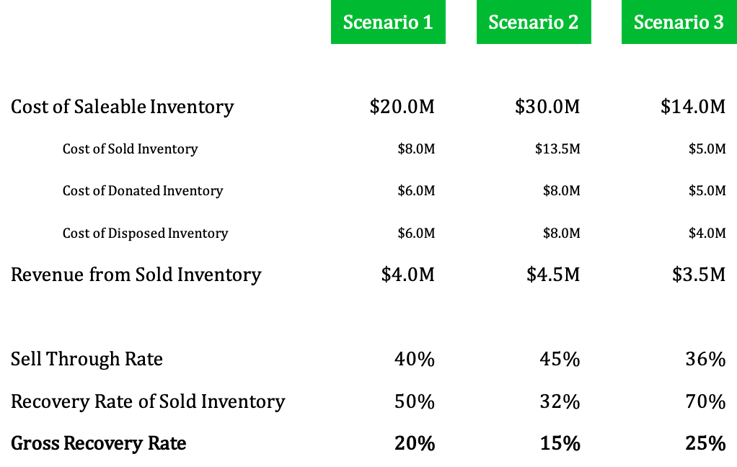
Why Gross Recovery Rate is powerful is that it consistently measures the quality of a program over time, despite increases or decreases in the overall quantity of distressed inventory available, which is often outside of the control of the sales team responsible for selling product.
To hit this point home, what if in the next fiscal year, this same food manufacturer generates $4.5M in revenue from its liquidation efforts. A positive trend? Not if overall distressed inventory increased to $30M, in which case its Gross Recovery Rate decreased to 15%. What if instead revenue dropped to $3.5M. A negative trend? Not if overall distressed inventory decreased to $14M, in which case its Gross Recovery Rate increased to 25%.
KPIs drive action and collaboration
Ultimately, these KPIs are only as good as the actions they inspire, and each KPI has a series of sub-KPIs that we use to optimize results. In future posts, we'll offer a more detailed set of metrics that influence financial results. Sell Through Rate, for example, should be at the forefront of supplier and customer-partner collaboration to maximize benefits for both.
Can’t wait for future content? Shoot us a note and learn how leading food brands are leveraging these KPIs to drive results!